Energy consumption
Energy consumption
As is the case for all western industrialised countries, Austria’s energy consumption is still dominated by fossil fuels, i.e. oil, coal and gas. It is true that Austria has a higher share of renewables in energy consumption than most other EU countries. Even so, the share of fossil fuels is still larger and has only slightly decreased, from 65% in 1990 to 58% in 2010.Gross domestic energy consumption and real GDP
The effects of the economic crisis on energy consumption became evident in 2009. For Austria, the crisis meant a 3.9% decrease in its real GDP. This of course impacted energy demand (in particular in the manufacturing and transport sectors), which fell by close to 4% in 2009. The following year then saw a return to a much livelier development of both energy consumption and GDP.Gross domestic energy consumption and real GDP
Click the icon on the left to open the figure

Gross domestic consumption
Even before the economic crisis, energy consumption had been going sideways. Total energy consumption rose steadily until 2006 before stagnating in 2007 and 2008. The dip in consumption can be traced back to the mild winter. This was reflected in a drop in degree days, which were 6% (2006) and 9% (2007) below the long-term trend (source: Statistics Austria). The gross domestic consumption in 2009 was 1354 PJ, in 2010 it rose by almost 7% to 1458 PJ. This was the highest number since 2010.Gross domestic energy consumption, 1990–2010, PJ
Click the icon on the left to open the figure

Final energy consumption by sectors
The second key indicator of consumption is total final energy consumption broken down by sectors. Trends in total final energy consumption have mirrored those in gross domestic consumption. The long-term trend is upwards, but recent years have seen stagnating or, in 2009, falling consumption due to the economic crisis. Between 2008 and 2009, total final energy consumption dipped by 4% only to rise again by 5.6% in 2010. This increase was strongly driven by the service sector, which saw a 22.2% increase in total final energy consumption from 2009 to 2010. Even so, it was a small increase in absolute terms. Industrial consumption only increased by 0.5% during the same time; this is due to the fact that some industries even saw demand drop. Households, whose consumption had edged upwards by 0.3% in 2009 in spite of the crisis, had an 8.8% increase in 2010. This might be due to the weather.
Final energy consumption by sectors, 1990–2010, PJ
Click the icon on the left to open the figure

Energy mix of final energy consumption
Major changes in the 1990–2010 period were the fall in the contribution of coal from 7% to 2%, and the increase in the share of renewables from 12% to 14%. The district heating share increased from 3% to 7%. The percentages of fossil fuels (oil, gas and coal) were quite constant during this time. Even so, they still account for the lion’s share of total final energy consumption; they accounted for 65% in 1990 and still 58% in 2010.
Energy sources as a proportion of total final energy consumption, 1990 and 2010
Click the icon on the left to open the figure

Households
Households have accounted for constant increases in demand. When there are consumption dips, these are usually due to the weather or the 2009 financial and economic crisis. Household energy consumption in 2010 was 66% higher than in 1970.
Final household energy consumption, 1970–2010, PJ
Click the icon on the left to open the figure

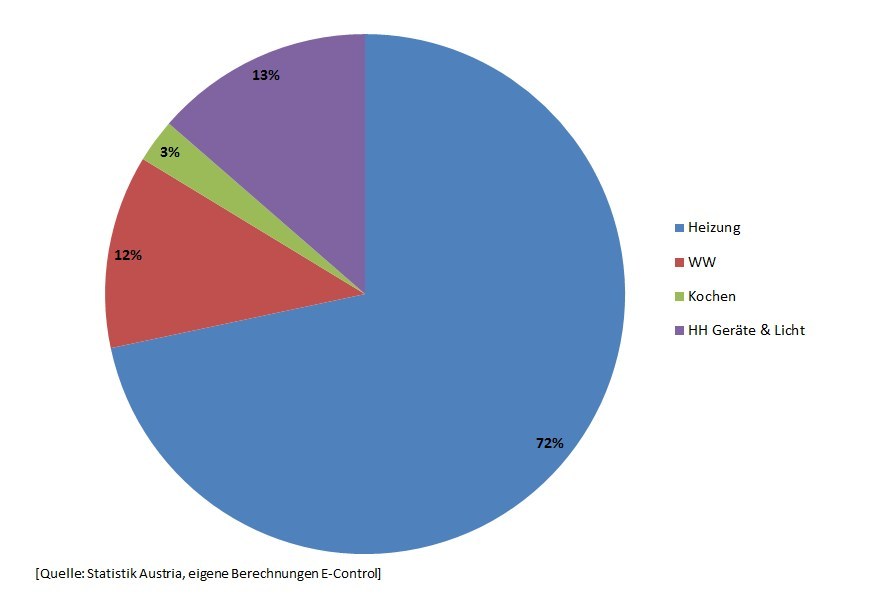
Households use about 72% of their energy for space heating, 12% for heating water, 3% for cooking and 13% for electronic equipment such as household appliances or lights.
Household energy consumption
Click the icon on the left to open the figure
The energy efficiency of buildings and of appliances has increased, but a number of other factors have more than compensated for this reduction in energy use.
For instance, households have more and more electronic equipment. Fridges, freezers, washing machines etc. have become a matter of course to most of us. Many families keep old appliances, e.g. old fridges, and use them as back-ups. Recent years have seen a rapid increase in entertainment electronics and air conditioning equipment.
Also the changing size and structure of households drives energy consumption. Each year, close to 40,000 new homes are built in Austria. There is a trend towards more space per person, but also towards more and more one-person households.
Number of households in Austria (overall and one-person households), index 1985 = 100
Click the icon on the left to open the figure
